Once something is in production, you are no longer just building software. You are also keeping it alive. That sounds obvious, but teams forget it all the time. We get excited about features, migrations, rewrites, platform work, whatever is next. Then the system starts failing in small, boring ways. Search is slow. Booking breaks. A background job dies repeatedly. One customer cannot load the dashboard. Another gets the same timeout three times and opens a support ticket.
If you are a SaaS company, that customer may be running part of their business on your product. If you are building for consumers, they just leave. They do not care whether the issue was caused by a dependency, a queue, a database lock, or a deployment that looked safe.
They came to do something. Your system got in the way. Sometimes you pay for that with credits or refunds. More often, you pay with trust. That is harder to see on a dashboard, and much harder to win back. This is where reliability gets practical. You cannot just say the system should be reliable. Reliable compared to what? For whom? Over what period? At what cost?
This is where error budgeting, Mean Time to Detect (MTTD), and Mean Time to Recovery (MTTR) come in. Think of error budgeting as your allowance for risk without compromising reliability. It tells you how much downtime you can afford before shifting focus from new features to stability. MTTD and MTTR, on the other hand, answer important questions: how fast you detected the issue, how you recovered, and how long it took. Let us dive in and see how these metrics help manage risk and strengthen long term reliability.
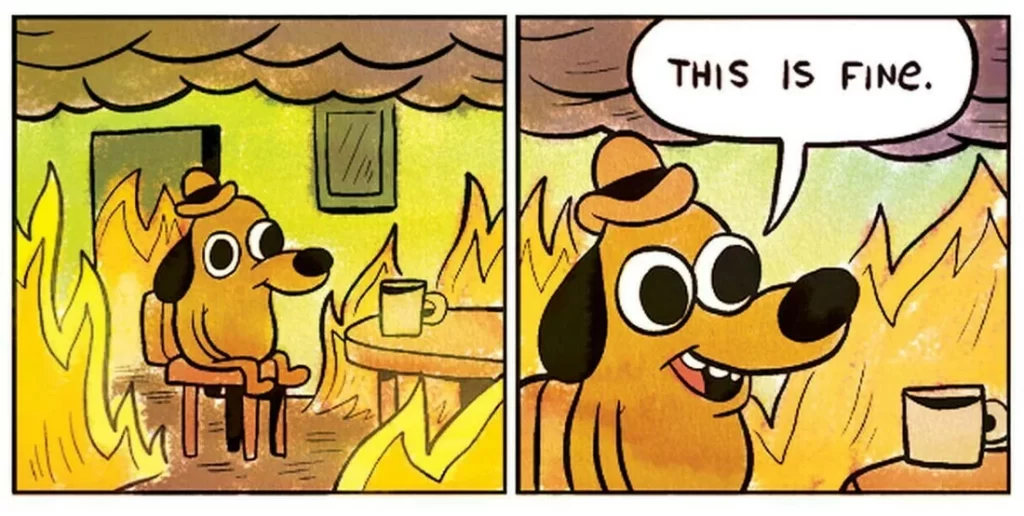 This is fine until it is not
Setting the Foundations
Before we talk about error budgets and recovery, let's cover Service Level Indicators (SLIs) and Service Level Objectives (SLOs). They form the language of reliability and create a shared understanding across teams.
SLI
This is a metric that shows how well your service is performing. It could be latency, error rate, or availability. SLIs are the performance indicators that help you understand if your system meets its goals.
SLO
This is the target for an SLI. For example, if your SLI is uptime, your SLO might be 99.9% uptime. SLOs are the internal goals that help ensure your service stays reliable for users. They create a clear threshold for acceptable performance.
SLA
SLA is a formal contract between you and your customers where you outline the expected level of service. It includes specific SLOs, and if these objectives aren’t met, you typically face consequences, mostly financial. SLAs are external commitments to customers and they require consistent operational discipline.
Reliability management depends on SLIs and SLOs. They provide a way to measure and improve your service quality. They also form the foundation of error budgets. You can then define what level of service is acceptable before you shift priorities away from feature delivery and towards stability.
Error Budgeting
An error budget quantifies the acceptable amount of system unreliability over a specified period. For instance, error budgeting tells you how much downtime is okay over a given period. Say you want 99.9% uptime for your system. You can use error budgeting to see what that means in practice:
- Service Level Objective (SLO): 99.9% uptime
- Total Time Period: 30 days (43,200 minutes)
The allowable downtime is:
- Allowable Downtime = Total Time * (1 - Uptime %)
- Allowable Downtime = 43,200 minutes * (1 - 0.999)
That gives you 43.2 minutes of allowable downtime in 30 days. So, your error budget is 43.2 minutes for that period.
An error budget helps you understand how fast you should go. You want to introduce new features while keeping systems reliable. Once you are out of the error budget, leadership needs to make a decision. Should you slow down or stop feature development? Should you focus solely on reliability? Clear thresholds make these trade offs explicit instead of emotional.
Having error budgets also provides clarity. It becomes a communication tool. They help make reliability tangible. Now you are speaking with data instead of assumptions. When error budgets are low, everyone becomes aware that they need to focus on reliability. Then you can agree on the actions to take, such as slowing down releases or prioritizing fixes. This shared understanding reduces friction between product and engineering teams.
MTTD
Mean Time to Detect (MTTD) is the average time it takes to find an issue. The faster you detect, the faster you can respond, which directly impacts reliability. MTTD measures how well your monitoring and alerting systems catch issues before users feel the impact.
A low MTTD means your detection mechanisms are effective. A high MTTD means problems stay undetected longer, causing more damage. Reducing MTTD is critical for keeping services smooth and customers happy and for keeping incident scope as small as possible.
In some cases, your monitoring and alerting may not even catch the issue, so you learn it from the customer. That is plain bad. You should fix these cases and have proper alerting for these scenarios. If your users discover issues before your systems do, that is a sign that your observability strategy needs serious revision.
MTTR
Mean Time to Recovery (MTTR) measures how quickly you can fix a problem and get back on track.
For example:
- Total Downtime: 240 minutes
- Number of Incidents: 6
The MTTR is:
- MTTR = Total Downtime / Number of Incidents
- MTTR = 240 minutes / 6 = 40 minutes
A lower MTTR means higher resilience since you are recovering faster. But measuring MTTR can be tricky. It is even harder if it is not a single service but a complex, multi-step recovery. MTTR needs a clear incident lifecycle, and without it, your MTTR might be unreliable. Measuring how fast and how well you recover provides additional data points for leadership and helps teams understand where recovery efforts break down.
There is some criticism towards MTTR as a metric. People often argue that MTTR can be misleading because it assumes all incidents are equal, which they are not. Some incidents are minor, while others are major and take much longer to resolve. This variability makes it hard to truly assess reliability using just MTTR. This is why I think we need to consider other relevant metrics such as MTTD to see the overall impact of an incident and to understand the full lifecycle cost of a failure.
Moreover, MTTR is often conflated with Mean Time to Respond, which focuses more on the response initiation rather than the complete recovery. A good response time does not always mean a quick recovery, especially if the issue is more complex. These should be treated as distinct metrics with different purposes.
Another point worth noting is that not all recovery times are created equal. The MTTR that matters is the one that minimizes the overall impact on users. In practice, we need to focus on decreasing user experience based downtime. Partial service outage, if it does not lead to downtime, should not be part of the calculation. It is about understanding which parts of the recovery are most critical for the customer experience and optimizing those first. This shifts the focus from theoretical recovery to meaningful recovery.
Services vs. Platforms
The reliability metrics we use such as MTTR, MTTD, and error budgets are not straightforward to apply across different types of systems. The distinction between a service, potentially a microservice, and a platform like a Spark application is important here. Microservices are usually small, self-contained, and have clear boundaries, which makes it easier to define and measure metrics like MTTR and MTTD. Each service can be monitored independently, and issues are typically localized, allowing teams to detect and recover quickly with predictable blast radius.
On the other hand, a platform that offers Spark execution is a different beast, since it provides a distributed data processing system. It often relies on many interdependent components: resource managers, executors, drivers, storage layers, schedulers, networking, and sometimes external systems like Kafka or object storage. A failure may start in one place but surface somewhere completely different. Measuring MTTR and MTTD for such an application can be tricky because an issue in a Spark job may not be isolated. Problems can pop up due to data ingestion, resource allocation, or even networking. In such cases, the recovery is not just about restarting a single service; it involves diagnosing multiple components, which can drastically increase recovery time.
This inherent complexity makes defining SLIs and SLOs much more challenging. For distributed compute, you must consider availability of the control plane, job completion success rate, queueing delay, and cluster health. If you pick the wrong SLI, you will end up measuring noise instead of reliability. Thus, it complicates the implementation of a realistic error budget.
Getting Metrics Implemented
Defining these metrics is one thing, but implementing them properly is a real challenge. If you own a service that depends on multiple departments and services, convincing everyone to do their part can be tough. Resiliency cuts across teams, and often people do not see it as their responsibility. Each and every service contributes to overall reliability. Nonetheless, it is easy for teams to think, “That is not my job.” Hence, educating people about the importance of resilience is also a big part of the job and requires continuous reinforcement, not a one-time announcement.
The other part is the measurement. All teams need to use the same tools to create a consistent, global understanding of how reliable your systems are. Otherwise, you will not be able to report a consistent view. This again goes back to education. You need to train the staff to use the same tools and to interpret the metrics in the same way. Without shared definitions, even good data becomes misleading.
When the Budget Runs Out
Most teams burn through their error budget and nothing happens. Deployments continue. Features ship. The number resets next month. At that point, the budget is theater.
The fix is a written policy with teeth. Google’s version is simple enough: when a service burns its error budget over a four-week window, non-critical changes stop until the service is back within SLO. It gives teams permission to stop shipping and fix the system without having to fight the same argument every time.
Somebody still has to own the call. Usually that means the SRE engineering leaders, but the policy only works if they have enough authority to say no to product. Otherwise it becomes a polite suggestion. I have seen this fail. The budget runs out, the owner flags it, a launch is declared too important, and the freeze never happens.
The sneakier failure is renegotiation. The team does not ignore the budget. They lower the SLO. 99.9% becomes 99.5%, the dashboard improves, and production gets worse. SLO changes need the same scrutiny as budget violations. Otherwise every team gets a pressure valve for uncomfortable moments.
Automation helps. A deploy gate during critical burn removes the human decision when people are least likely to make the right one. It will not fix weak governance, but it makes ignoring the policy harder. That alone is worth something.
In Consequence
Reliability is an organisational problem. The metrics are the easy part. You can define these in an afternoon. But a dashboard full of well-defined metrics does nothing if teams treat reliability as someone else's responsibility. The oncall engineer paged at 3am is not the reliability strategy. They are the last line of defence in a system that has already failed.
The organisations that get this right treat reliability as a constraint, not a goal. It has to be the same way they treat legal or compliance. You do not negotiate with it when it gets inconvenient. You build around it from the start. You need to shift that framing. Error budgets become a forcing function. MTTR becomes a design requirement. Teams need to ask "how do we make this failure mode impossible?"
Reliability compounds. A team that invests in it early moves faster later, because they are not constantly fighting fires they started themselves. A team that ignores it spends more and more of its capacity just standing still. Deprioritising reliability is not saving time. It is borrowing time from every future team that has to live with the mess.